2013 By The Numbers.

2013…

it’s been a tough year – after 18 months of working on lots of long steady distance stuff to get the weight down, my direction shifted a little to getting better quality mileage in. By and large, I seemed to get there, with a few exceptions…

Plan was to keep the distance target from 2012 – i.e. 10,000km but wherever possible make that 10,000km of OUTSIDE riding.

Anyway, here goes

Distance – 11,162.36km (6,935 miles)
Time – 20d 19h 23m 46s
Elevation – 92,786m (57.6 miles)
Rides – 240

Longest ride –  135.5km on a cold and windy day in april

Hilliest ride –  1396m on a mentally windy day, riding around what felt like every hill within a 20 mile radius of my home.

2013 was also the year when I revisited something I swore I’d never do again – I rode a couple of 10 mile Time Trials. Nothing “organised”, but on a “proper” course as used by my LBC (local bike club) – 27m 22s on a course that’s best described as a “sporting” rather than a “fast” route was a pleasant surprise – especially on a “normal” roadbike rather than anything low-profile or aero.

As for the goal of actually getting fitter – there’s a slight anomaly in the figures – you’d probably expect the average speed of my rides to have increased, but actually the average speed DROPPED slightly from 2012’s 23.2kph to 2013’s 22.9kph. However, that’s actually partly because the harder sessions of riding meant that I had to ride a greater proportion of very low intensity recovery sessions. In other words, the fast sessions got faster, but the slow sessions got even slower! Probably a better metric of my improvement would be found in the geekier realms of power and FTP numbers. My final FTP test of 2012 had me turning out 182w. By the end of 2013 I’d bumped that to 262w, a pretty staggering 44% improvement!

Final Line in the Sand for 2013…

Yep, it’s that time again, to drag out the indoor trainer, wire up the bike with the powermeter to it, and commit myself to 20 minutes of bloody sheer agony.

We’re talking FTP tests folks.   A proper one now, with a proper accurate strain gauge based power meter.

Ride’s straightforward – a simple warmup, 5 minutes easy spinning followed by 3 x 110 cadence for a minute, with a minutes 80 cadence between ’em, and a 3 minute “psyche yourself up” break.  Then Nail it for 21 minutes, as hard as you can go…  As an indication, if my HR gets above 170 i’m in serious danger of blacking out – so, I pretty much dialed the pain gauge up until HR hit between 160 and 165 and kept it there for just over 20 minutes, including actually “sprinting for the line” at the end of the session.  Then “blew up”…

All this is to establish the highest average power I could develop for a period of 20 minutes.   According to the plot from Garmin Connect, this came out at 276 Watts. FTP is calculated as being 95% of your Max20minPower – so a FTP of 262.2 – we’ll ignore the 0.2 though.

FTP December 2013

This then has a “knock on effect” through all my training etc. until the next test (probably in february, before the serious outdoor riding season gets into it’s swing).   The Effect is basically to change all the Training Zones a little…

Power Zones December 2013

For once, I’m actually going to link to Garmin Connect rather than Strava for this Ride – primarily because GC Doesn’t bollock about with the TSS and IF data like Strava does.   And frankly, as it’s a trainer ride, there’s no segments or other crap to worry about.

And that’s it for me today – I’m now going to collapse in a chair for the evening, and try and drink enough water that I get the metalic taste of blood at the back of my mouth and throat to disperse a little.

Time for a Recalibration

So, it’s jump on the Tacx Trainer, and do a ramp test.

Then, to get my legs working again afterwards dug out an ancient Tacx DVD of  the descent of the Gavia, done in 2 stages, as that’s how the ride was already segmented.

So, we’ve 3 strava sections here…

Ramp Test, Gavia 1, Gavia 2

No video or screenshots, its ANCIENT, and frankly, couldn’t find anything.

The New Season Begins Here…

… or more specifically, in the back kitchen, sat on the Tacx Bushido, cranking away like a hamster on a wheel.

Started the whole thing off with a 25 minute ramptest, designed to allow the Powercal Heart-Rate/Pseudo Powermeter to be calibrated.

there’s strava links for this fiendish little test here, and a quick graph from sportstrackes below…

Sportstracks Powercal Calibration Run - Power and Heart Rate Plot

Sportstracks Powercal Calibration Run – Power and Heart Rate Plot

Basically, this is a 5 minutes at 110bpm then 5×3 minutes at gradually increasing heart rates followed by another 5 minutes at 110bpm to cooldown again.

The data, when dropped into the Cycleops Poweragent software should allow the “personalisation” of the Powercal belt to the specific measured power output as measured with the real honest-to-god  powermeter from stages cycling.

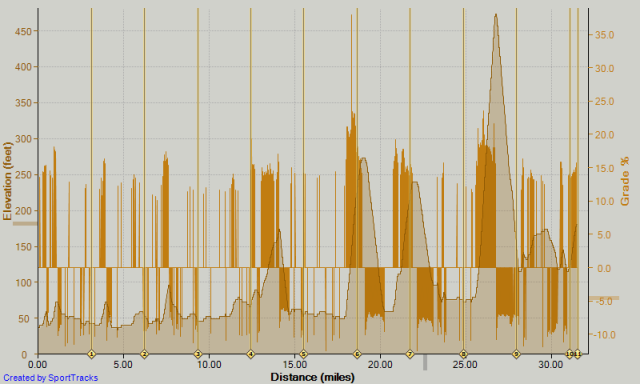
The Second phase of todays ride turned into a bit of a Hill-Intervals session using the Tacx VR DVD –  T1956.37 Milan Sanremo 2008 – I actually rode the first 50.8km of the course, and did all the minor Capi before the poggio and cipressa.   Frankly, that was enough, on top of the earlier ramp test…   especially as I didn’t want to end up completely spannered for tomorrow, in case the new bike arrives.

Once again there’s a Strava link to the ride here, and a plot from Sportstrack – this time showing the “virtual” ascent/descents…

Tacv VR Ride - Milan San Remo

Tacv VR Ride – Milan San Remo


At last – A PROPER FTP Test.

This time, I’d got all the Ducks in a Row.

I’ve got the Tacx Bushido indoor trainer coupled with a laptop running their TTS Software, and a specific FTP Test Protocol routine to provide the resistance, timing and display facilities.

I’ve got the Stages Powermeter –  a proper, strain based powermeter system, which measures the ACTUAL force through the pedals, not some “computer derived” formula based on the electrical current generated by the Bushido’s resistance unit.   And I’ve got the Garmin 800 to record the Heart Rate, Wheel Rotations, Cadence and power Data.   All the same stuff as I’d have if I were riding on the road.

The Test Protocol

The routine was based on a version of the Coggan/Allan FTP Test Protocol

It basically breaks down into a number of stages…


  1. 20 minutes of gentle spinning, 0% incline –  beginning in the middle range cogs at the rear and the small ring at the front – every 2 minutes, drop to the next harder gear to pedal, maintaining a steady 80-90rpm cadence.   At the end of this, you should be in the middle gear on the back and the large chainring.
  2. 1 minute of fast spinning, +0.2% incline, try and keep above 110rpm cadence, adjust gears as needed
  3. 1 minute steady spin, 0.2% decline, 80 rpm cadence
  4. 1 minute of fast spinning, +0.2% incline, try and keep above 110rpm cadence, adjust gears as needed
  5. 1 minute steady spin, 0.2% decline, 80 rpm cadence
  6. 1 minute of fast spinning, +0.2% incline, try and keep above 110rpm cadence, adjust gears as needed
  7. 5 minute steady spin, 0.1% decline, 80 rpm cadence
  8. 5 minutes hard “Pin it and Hold It” – +1.2% incline, go as hard as you can, sprinting for the end of the line at 5 minutes.
  9. 10 minutes easy spinning to clear lactate from last stage, 0.3% decline, 80 rpm, adjust gears as needed, trying to raise gearing back to final gearing from stage 1 by the end of the 10 minutes.
  10. 20 minutes of going as fast as you possibly can, 0.3% incline, try and keep power as stable as possible – don’t stop and start or ride in surges – just keep your HR a couple of beats below it’s maximum, and keep asking yourself “Can I Keep this up to the end” – if the answer is yes, go faster, if the answer is no, slow down a little, and if the answer is “maybe” you’re going hard enough.    Try and “sprint for the line” at the end of the 20 minutes again.
  11. 10 minutes easy spinning – try and ease your legs back into some form where they’ll actually do what you tell them to.

stop, get off the bike, dry yourself off, save the files on the computer and swallow your pre-prepared recovery drink.   Hopefully it’ll disguise the taste of blood at the back of your mouth and stop you being completely useless the following day.   Don’t worry, the dull headache usually recedes after a couple of hours.

So…   what did I learn from this test.

Well – after importing the ride into GoldenCheetah (it’s cheaper than WKO+ and I’m a tight Yorkshireman) and finding the best intervals for 3 minutes and 20 minute power,  I plugged them into the Critical Power estimator to calculate my FTP – in this case 259 Watts.

FTP_2013-10-03

Other things to note, for the 20 minute effort, the average power figure, and the “normalised” power figure (xPower) are almost identical – this indicates that the power delivery was relatively “surge free” – the more variable the power delivery is – i.e. if you sprint then freewheel, the xPower gets proportionally higher than the average (as the normalisation process takes more account of higher power figures than low)

So – what does this mean then…

Basically, now I’ve got a reliable FTP figure, that’s measured using exactly the same kit as I’ll have on the road, all the road rides can be directly compared to this test, I can set my training zones accurately, so when I’m supposed to be doing a recovery ride, I’m definitely recovering, and when I’m supposed to be working on Tempo, or Threshold, i’m DEFINITELY working at those zones as well.

At the moment, my training Zones, based on this test are as follows…

Zone 1 – Active Recovery – <55% of FTP – (0 – 142W)

Zone 2 – Endurance -55% > 75% of FTP – (142 – 194W)

Zone 3 – Tempo – 75% > 90% of FTP – (194 – 233W)

Zone 4 – Threshold – 90% > 105% of FTP – (233 – 271W)

Zone 5 – VO2Max – 105% > 120% of FTP – (271 – 310W)

Zone 6 – Anaerobic – 120% > 150% of FTP – (310 – 388W)

Zone 7 – Neuromuscular – >150% of FTP – (388W or above)